Analysis
The Analyse screen begins similarly to the Cultivate screen, with filters for library and book data. Instead of returning individual entries though, this screen generates charts based on the results.
Enter target library and collection, along with author, title and subject parameters.
Return chart data for groups like collection, library, and age
View chart data in various formats
Export in csv and html format
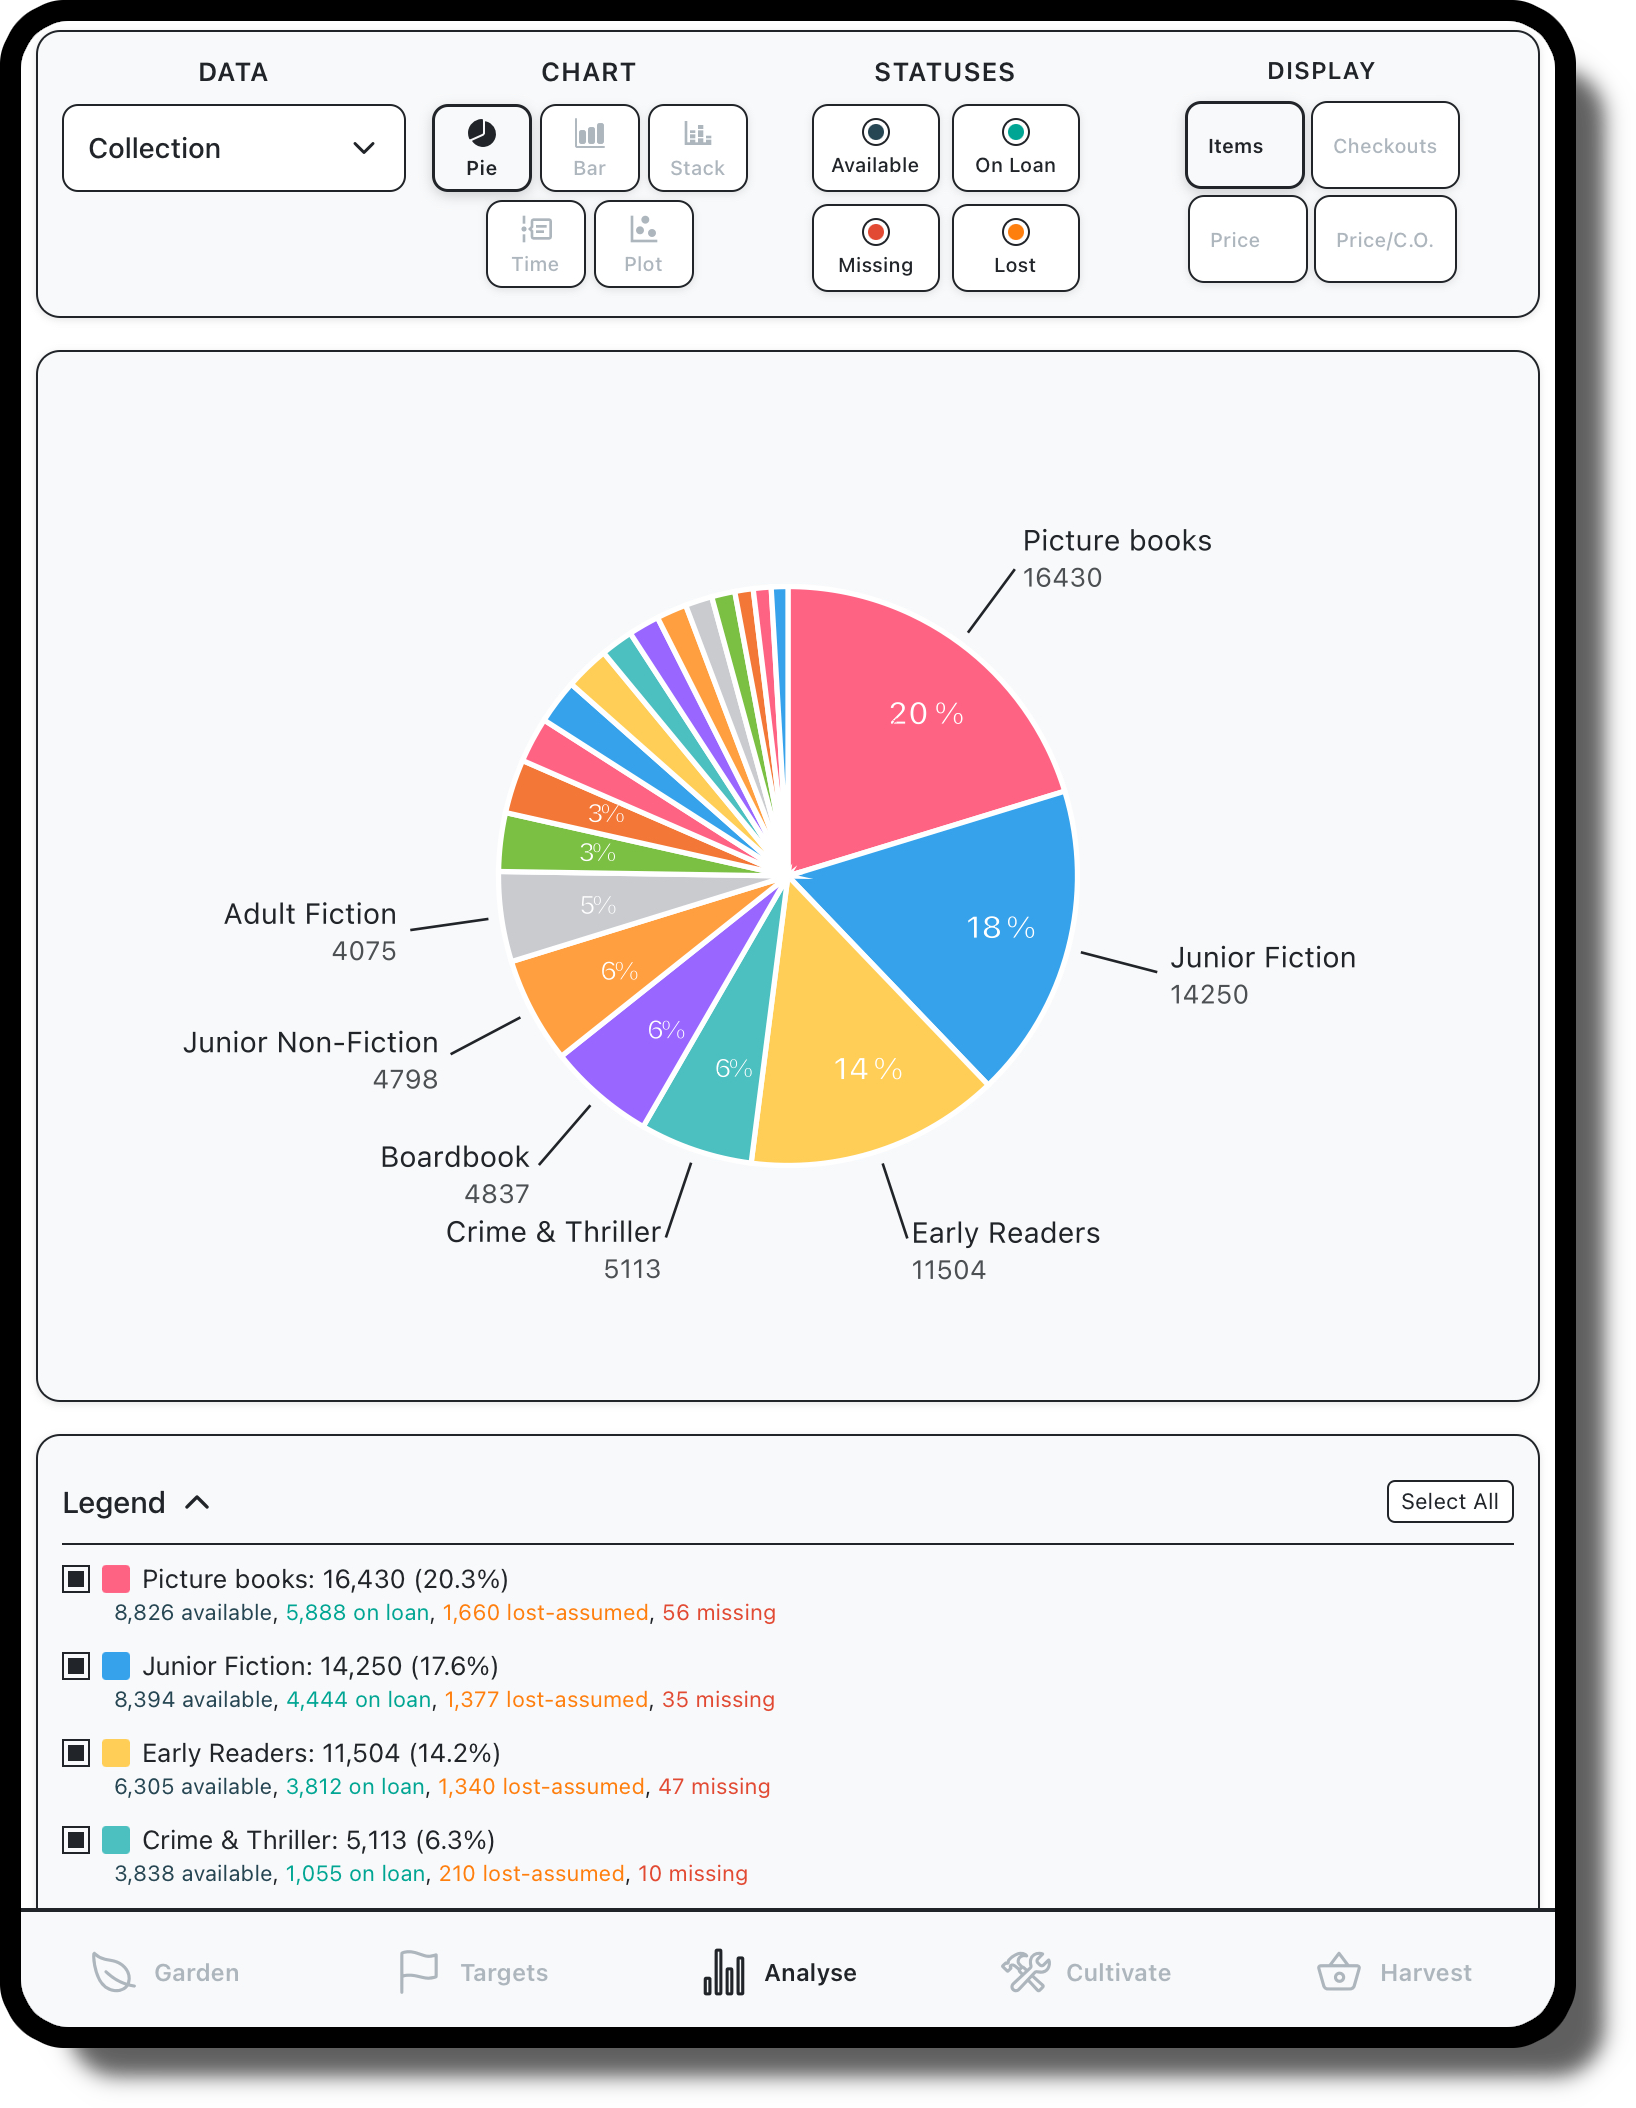
Once you’ve selected your desired collection, for this example we’ll use All Libraries & All Collections, the first chart control you have is Data, this selection controls how your selected data is further segmented for comparison purposes, the options are as follows:
Collection – segments data into collection type (note, if you only select one collection type from the filters above, there will be no further segmentation of the data)
Library - segments data into Library (note, if you only select one library from the filters above, there will be no further segmentation of the data)
Status – segments data based on the status column of collection data ie ON-LOAN, LOST etc
Age – segments data into grouping based on the age of item, 0-2 years, 3-5 years etc
Activity – segments data into groupings based on the last activity of an item, 0-6 months, 7-12 months, 1-2 years etc
Circulation – segments data into groupings based on the total loans
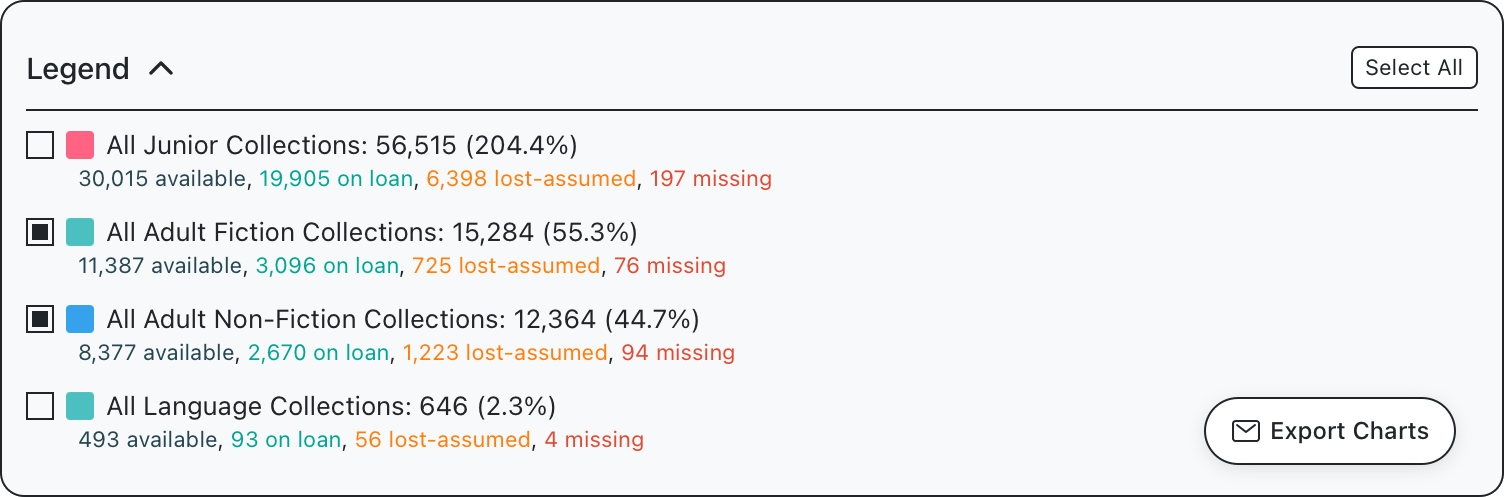
Collection Groups – segments data into collection groupings as defined by your library, eg Adult Fiction, Non-Fiction, All Junior Collections
Data
Display
Display selections allow customisation of each chart to display data as desired by the user.
Items – counts and displays the total items for each segment
Checkouts – counts and displays checkouts for each segment, available as Total or Average
Price – counts and displays price data for each segment, available as Total or Average
Price/C.O - calculates the total price divided by total checkouts to display a figure for the average cost of checkout across the segment.
On Loan % - calculates the percentage of items which are on loan.
For scatterplot charts, the DISPLAY value above the chart is referring to bubbles size, there are additional controls for x and y axis configuration below the chart.
Chart
The next option for selection is Chart type
Pie – displays data in a classic Pie chart showing each segment as a percentage of the total value. Each pie segment features a tooltip which reveals further info about that segment – Total and Average Checkouts, Total and Average Price, and Price Per Checkout.
Bar – displays data in similar format to a Pie chart but allows easier comparison of segments. Tooltip displays identical information as Pie chart
Stacked – data is displayed in bars, but each bar is coloured to denote the proportion of items within each bar with designated statuses – Available, Lost, etc. The tooltip on that stacked chart provides the totals for each status as a raw count and percent to total, including statuses grouped together as Active (for on-loan or available) and those with problems (for LOST, MISSING, etc)
Time – displays data segments across a timescale, from the earliest created date of an item to the most recent last activity. An optional feature to scale bar height based on total checkouts is available via a checkbox below the chart. The tooltip for this chart type is the same as Pie and Bar charts.
(Scatter) Plot - displays a relationship between data values across two axes, which may be customised using the display controls, see further information on display controls below. Toolitip is the same as for Pie and Bar graphs.
Status
You may toggle on and off the following status to update the charts to include or exclude each status
Available
On Loan
Missing
Lost
Legend
Each chart features a legend below detailing all segments available to view, these may be toggled to include or exclude as desired by the user.
Export
There is an export control which allows a .html & .csv file to be emailed to a provided email address.