Harvest
How can I view statistics for my crop?
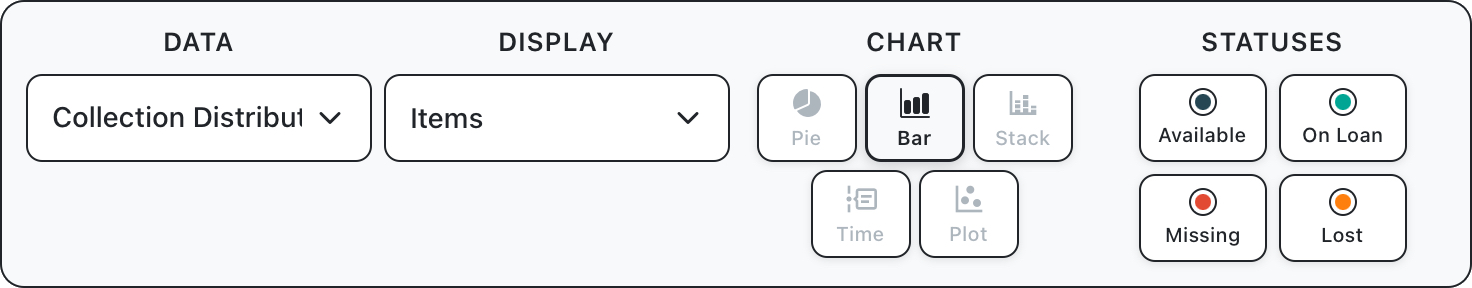
In addition to list and gallery view a statistical view is available for filtered books in the crop. To view chart data for a given crop, change the view mode to “Charts” to open a chart view. You’ll see a configuration panel showing controls to select the data and chart type, statuses to include, and display option.
Pie Chart
A basic pie chart showing the data distribution. Tapping on a DATA segment will open a tooltip displaying additional data from available DISPLAY options. Since Home % Garden is dwarfing the other options in terms of quantity, we can change the DISPLAY option to price/CO, to see the average value per checkout for each collection.
Bar Chart
Another simple chart representation. We can change the DATA and DISPLAY options to display the most popular authors in the group. The tooltip for this chart is the same.
Stacked Chart
Similar to bar chart, but bars are segmented based on STATUS, this chart is now displaying the breakdown of author items in the group, by available, on loan, missing and lost. Individual status option can be toggled from chart controls. The tooltip for this chart reports this status distribution for the DATA group.
Activity Chart
This chart represents the timeline for each dataset, from earliest creation date in the group to most recent activity date. The selected DISPLAY option is printed on top of the bar. The bars in this chart can be scaled according to quantity per year. So in this example, we’re showing a timeline for each author, with the bar height corresponding to checkouts per year.
Scatter Chart
Something of an experimental display, this chart lets you individually set parameters for x, y, and bubble size. In this example we can display collections by average number of checkouts against average price, with bubble size corresponding to price per checkout.
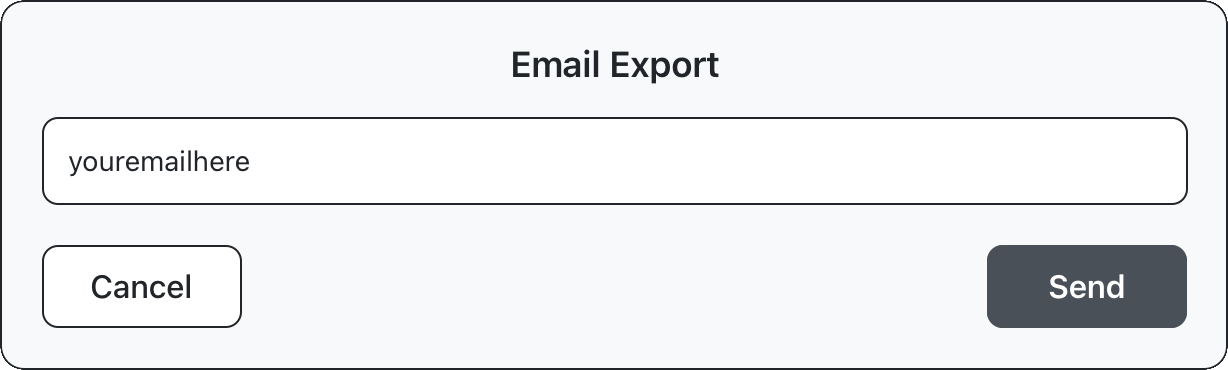
Export
Use the export button in the legend panel to export chart data. This will export csv data and html displays for all charts