Analysis
How many available items at my library are more than 5 years old?
Select Bar Chart as chart type, and “Price/C.O” as display metric, so that bars are displaying that average price per checkout (total checkouts divided total price) for each collection.
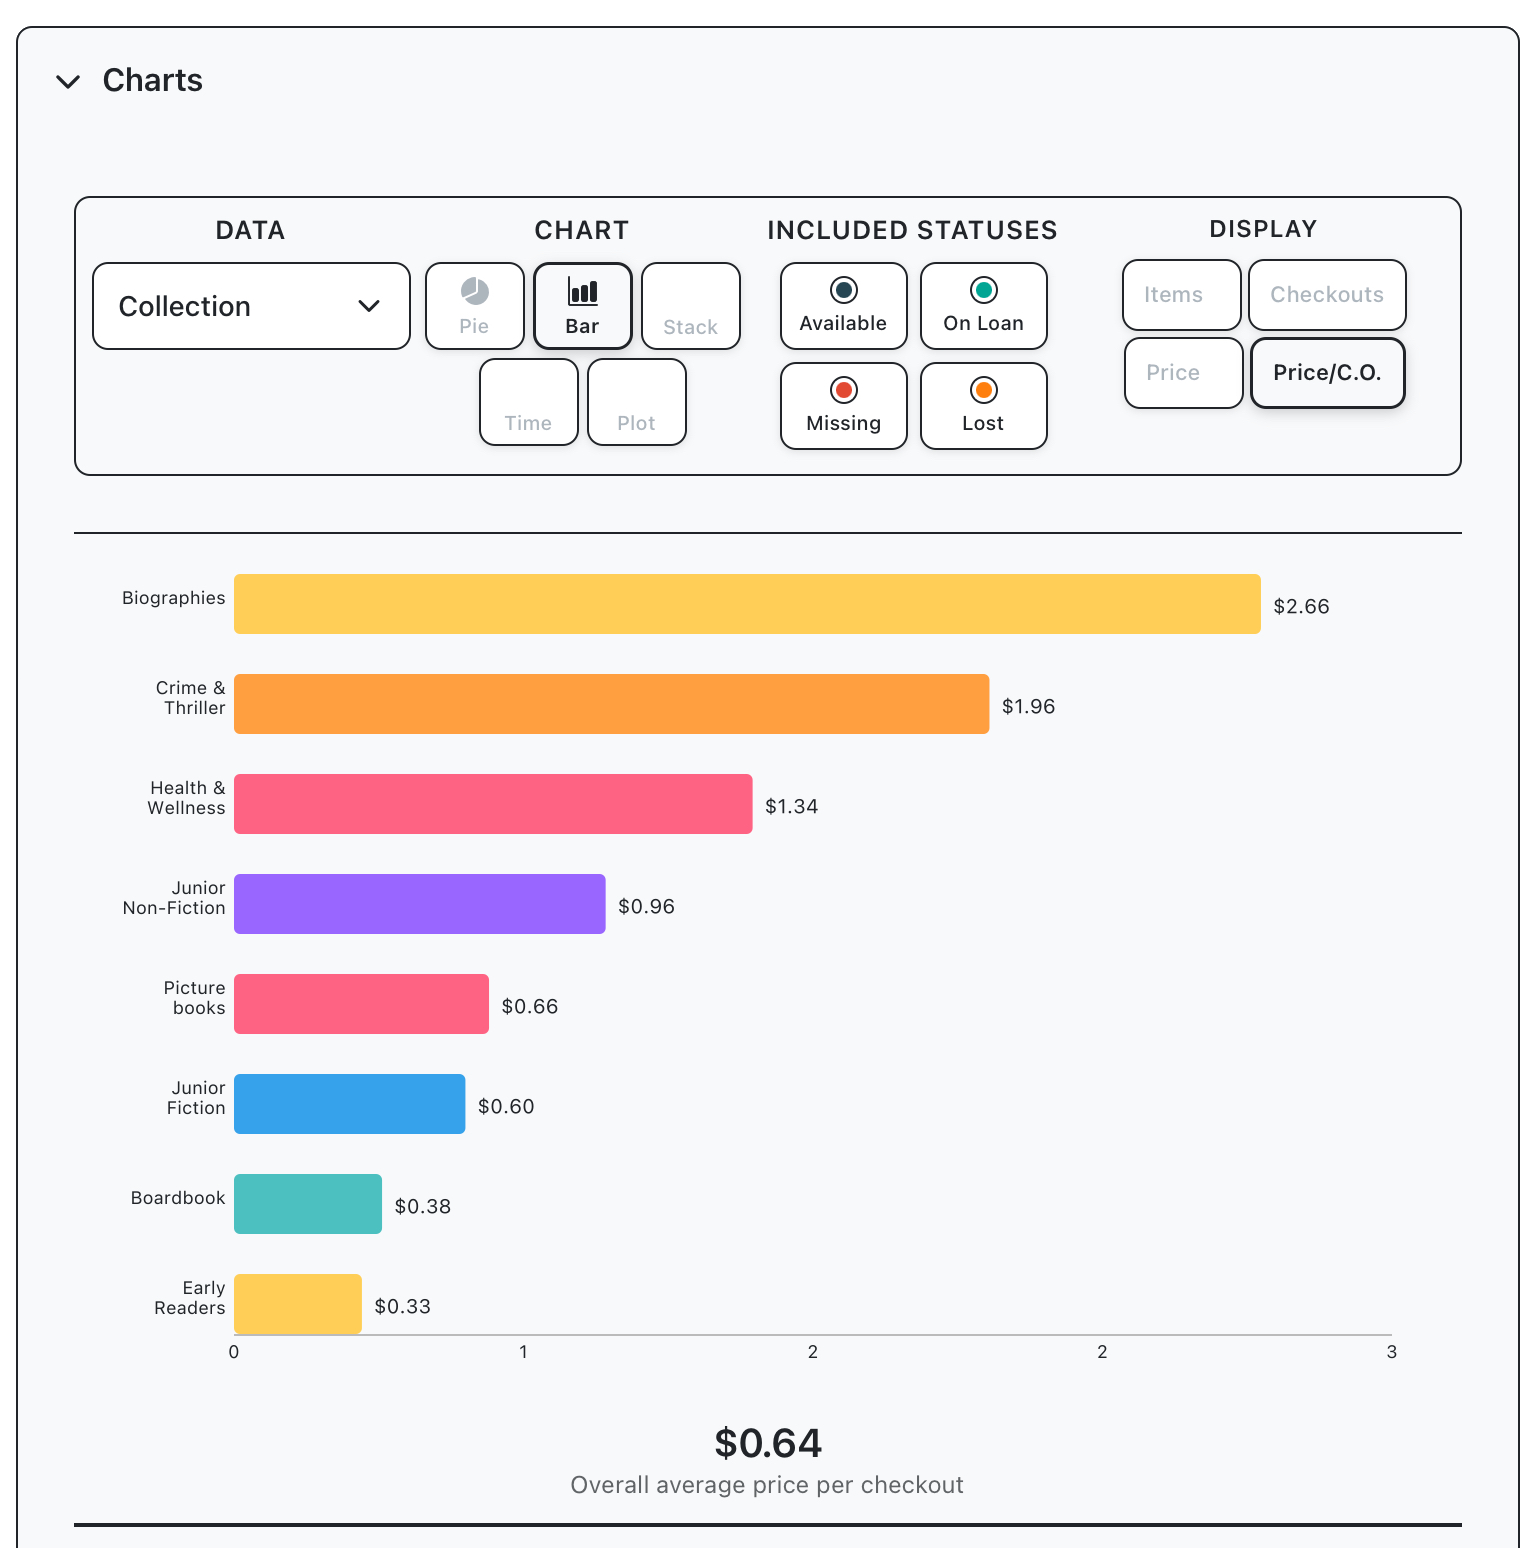
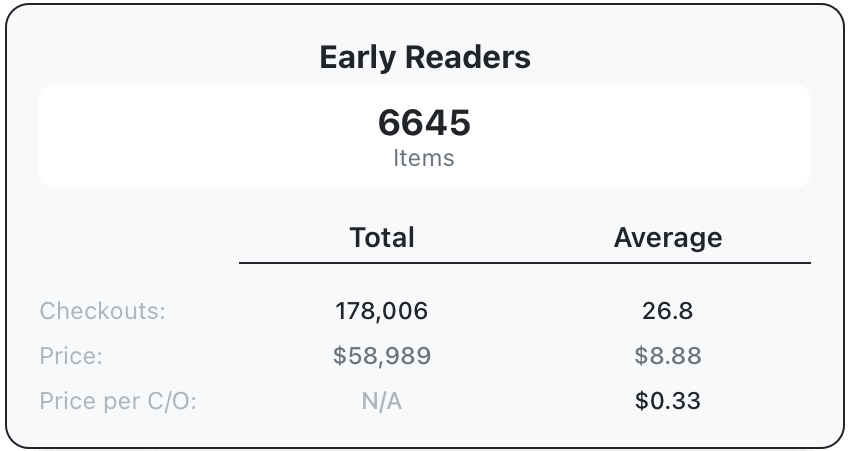
Scrolling to the bottom shows the collection with the lowest price per checkout, tap “Early Readers” to see additional information.
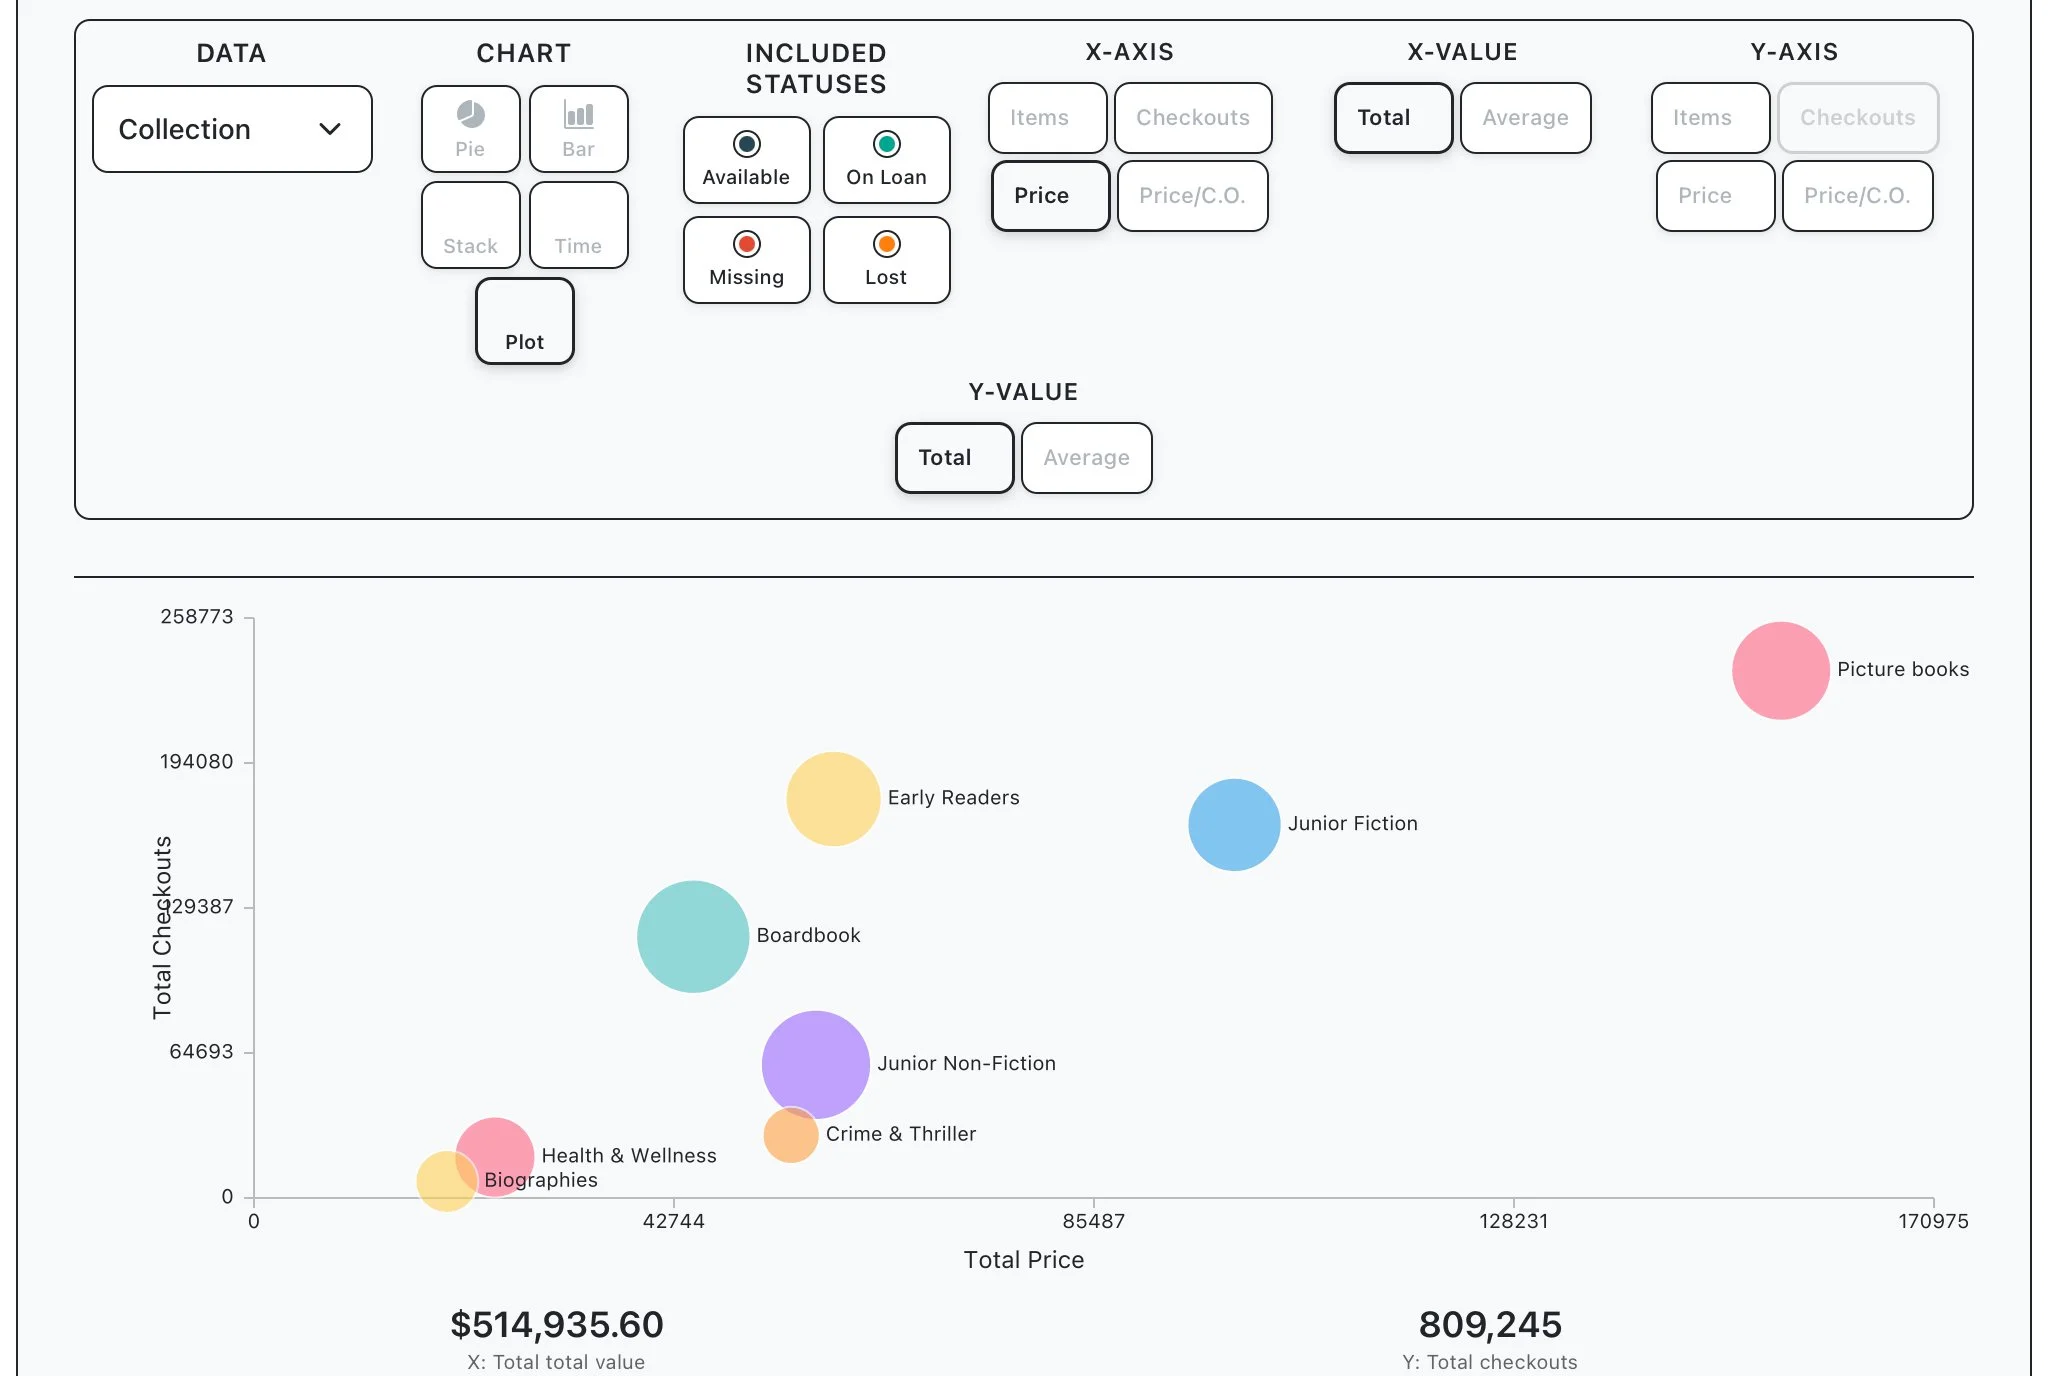
This information can also be viewed using the scatter chart type. Change chart type to “scatter”, change x axis to “price” and y axis to “checkouts”.