Targets
I’d like to create a chart showing the percentage fo each collection which is more than 5 years old
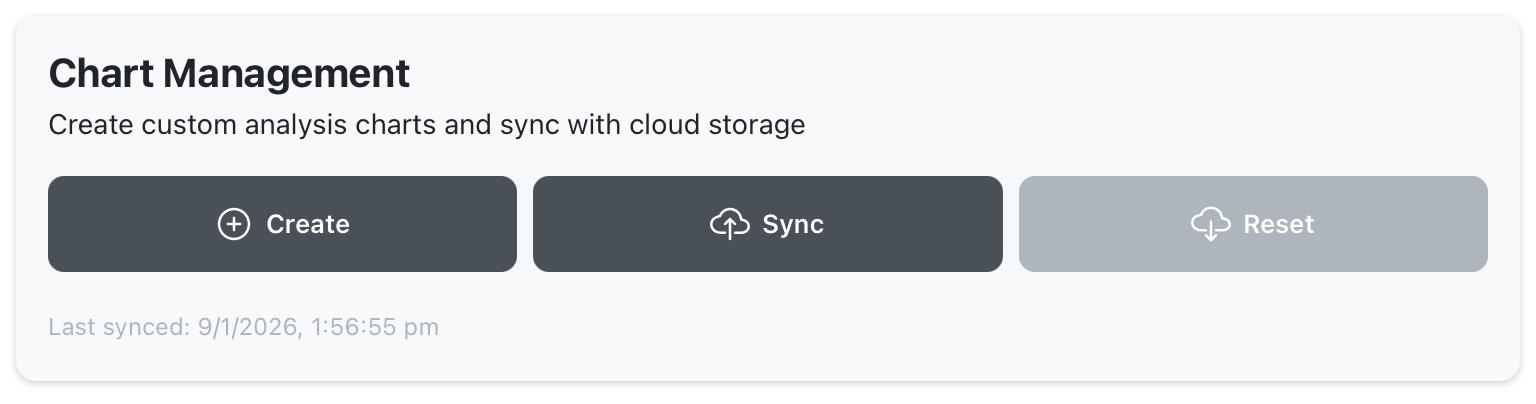
Create chart using guided walkthrough mode
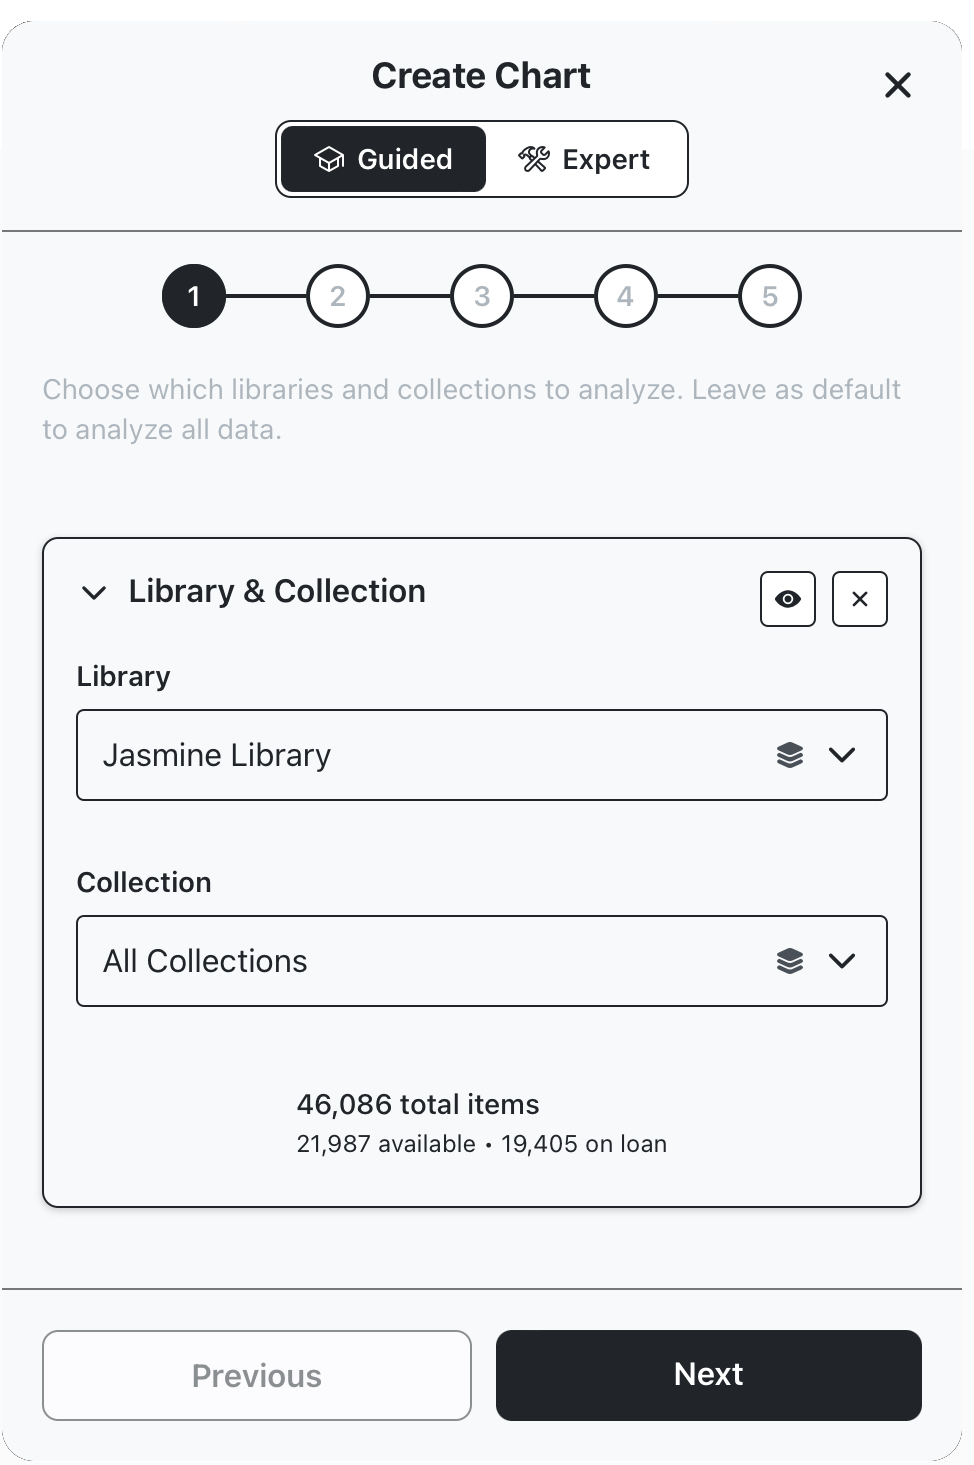
Select library and collection
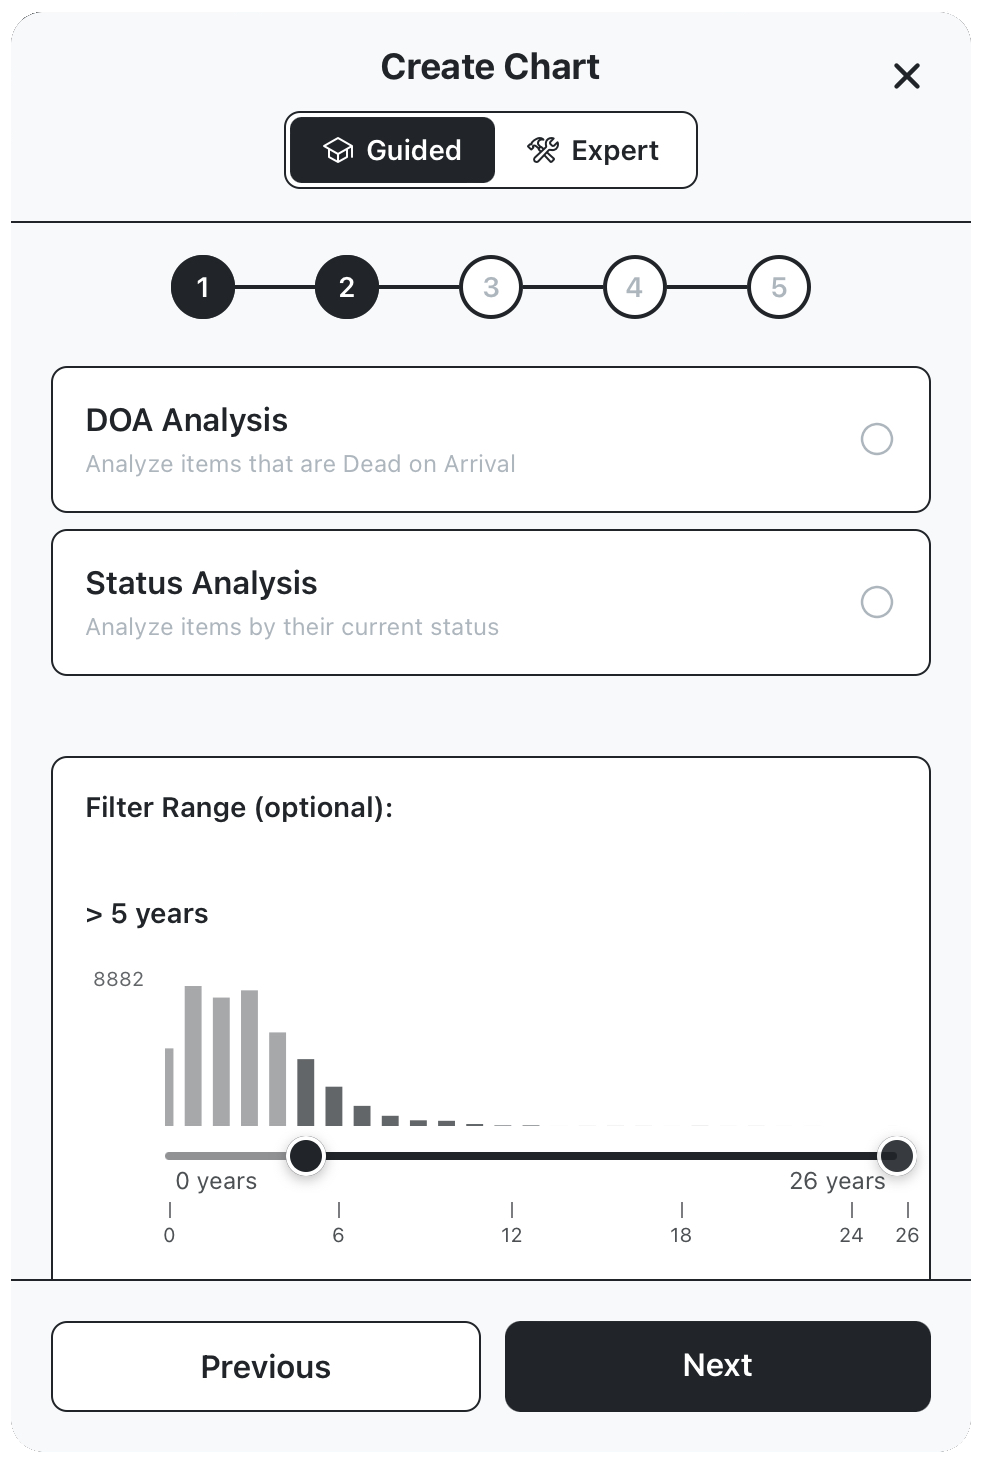
Choose analysis type
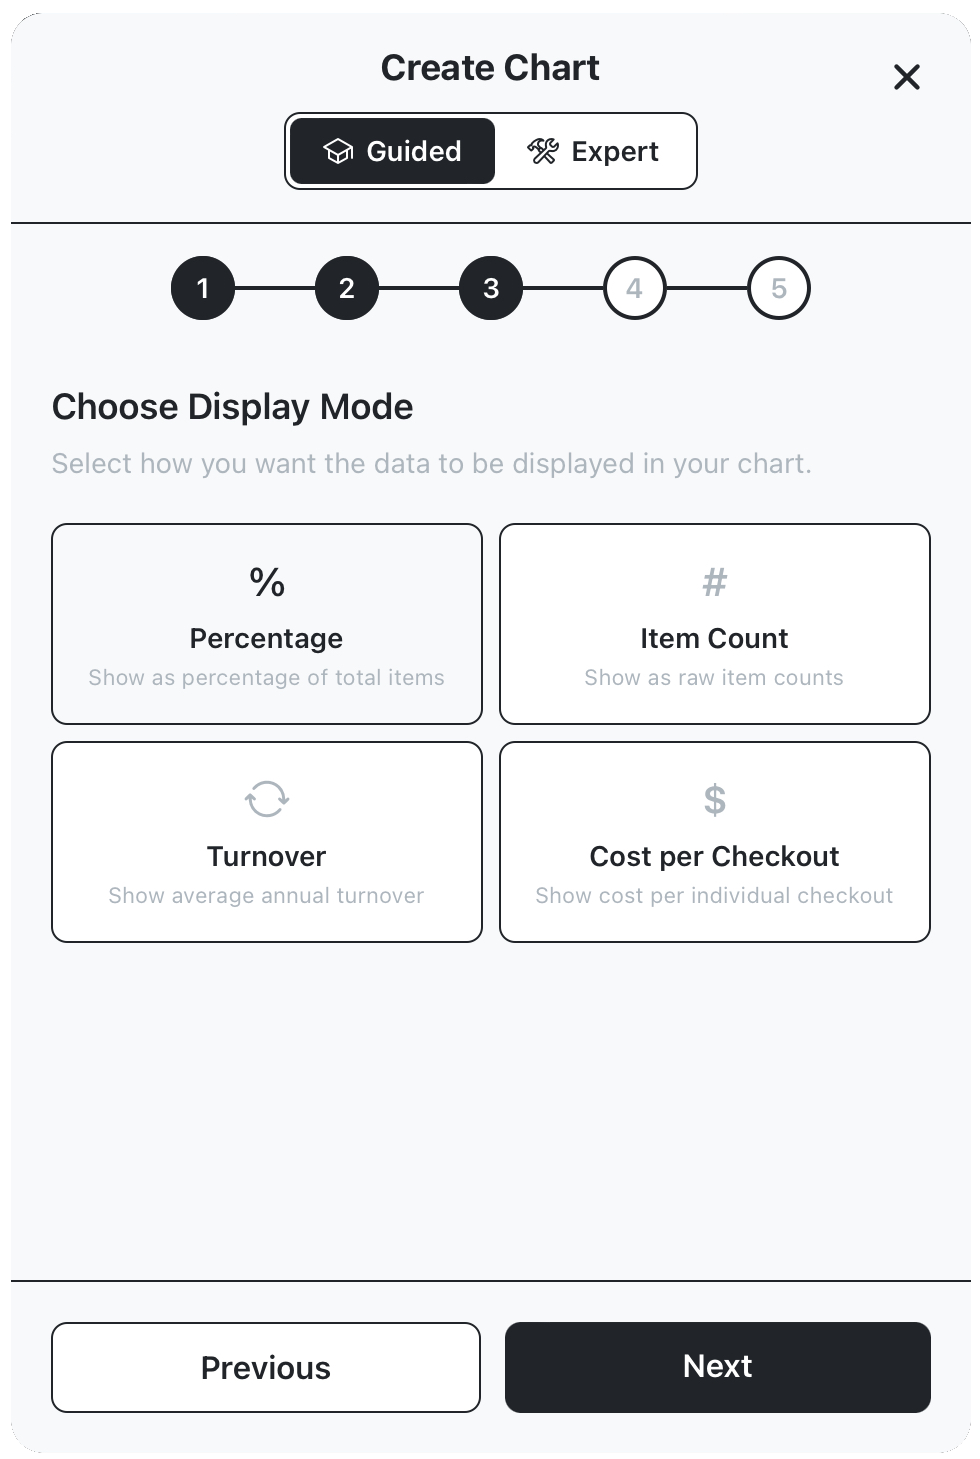
Choose display mode
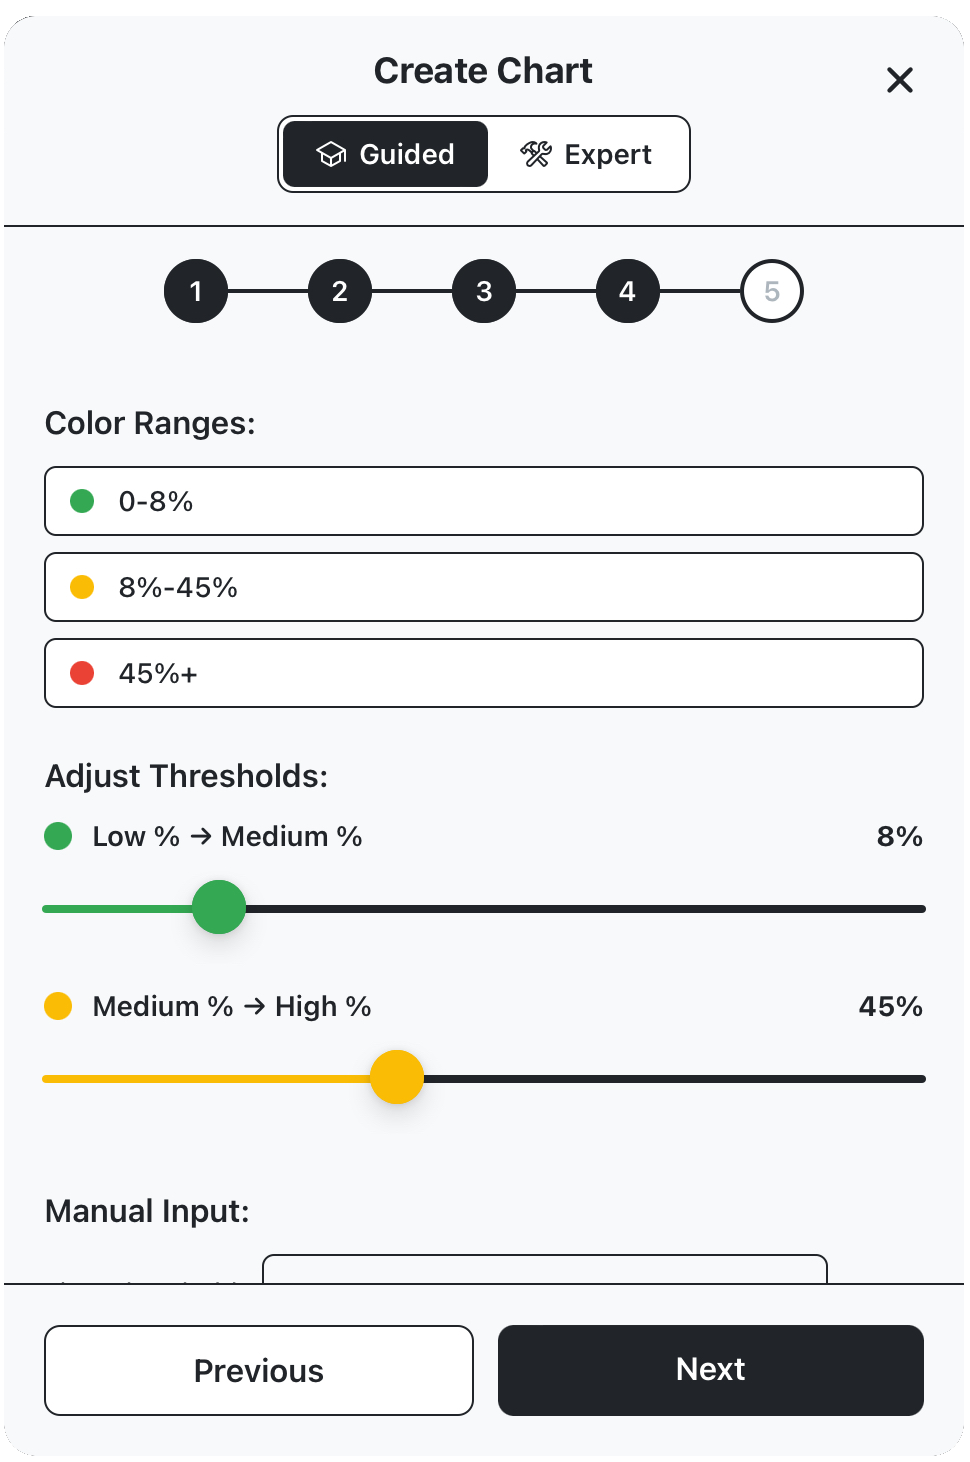
Configure colour targets and line displays
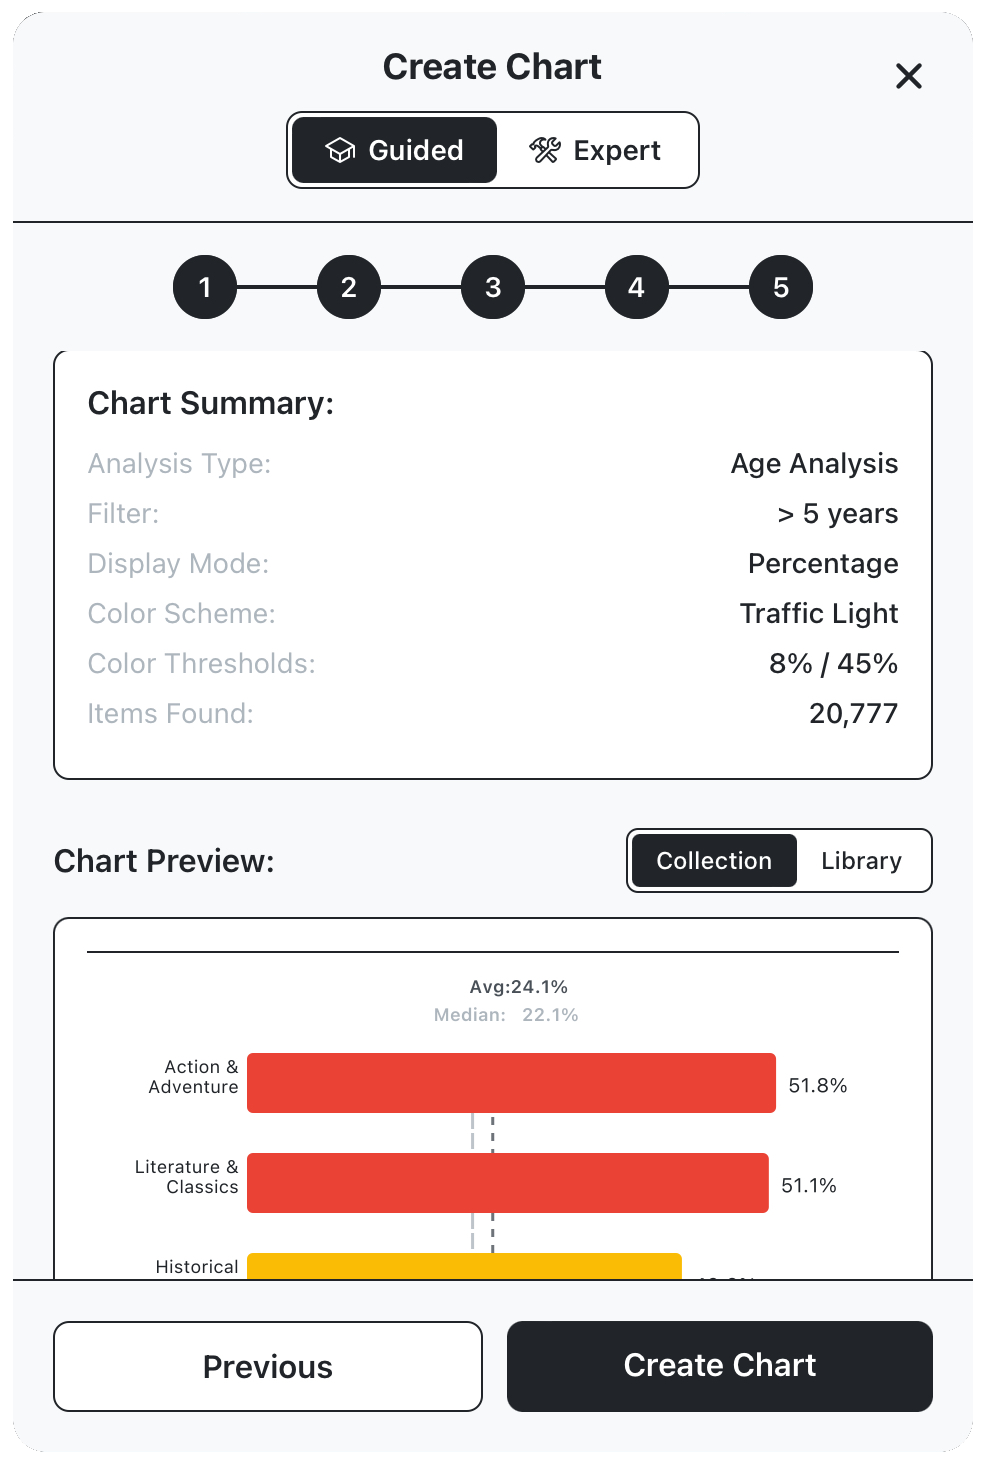
Preview chart details and name, click to create.