Harvest
The harvest screen is where you will be using the app to ‘take actions’ with the collection, whether that's pulling items for weeding, transplanting to another branch or just finding some titles for a display.
Edit crop name and type – edit crop name and type to make it easy to find.
Automatic availability and metadata lookup: books automatically look up ISBN, cover image, and availability data
Create manual displays – add items to a new manual crop by using the device camera to scan an items barcode, enter barcodes directly or use the search function to find items by author, title and subject.
View chart data – use the chart function on the harvest screen to visualize granular data for small crops of items.
Create display images – quickly make attractive digital assets using the digital images of book covers for items in your crop.
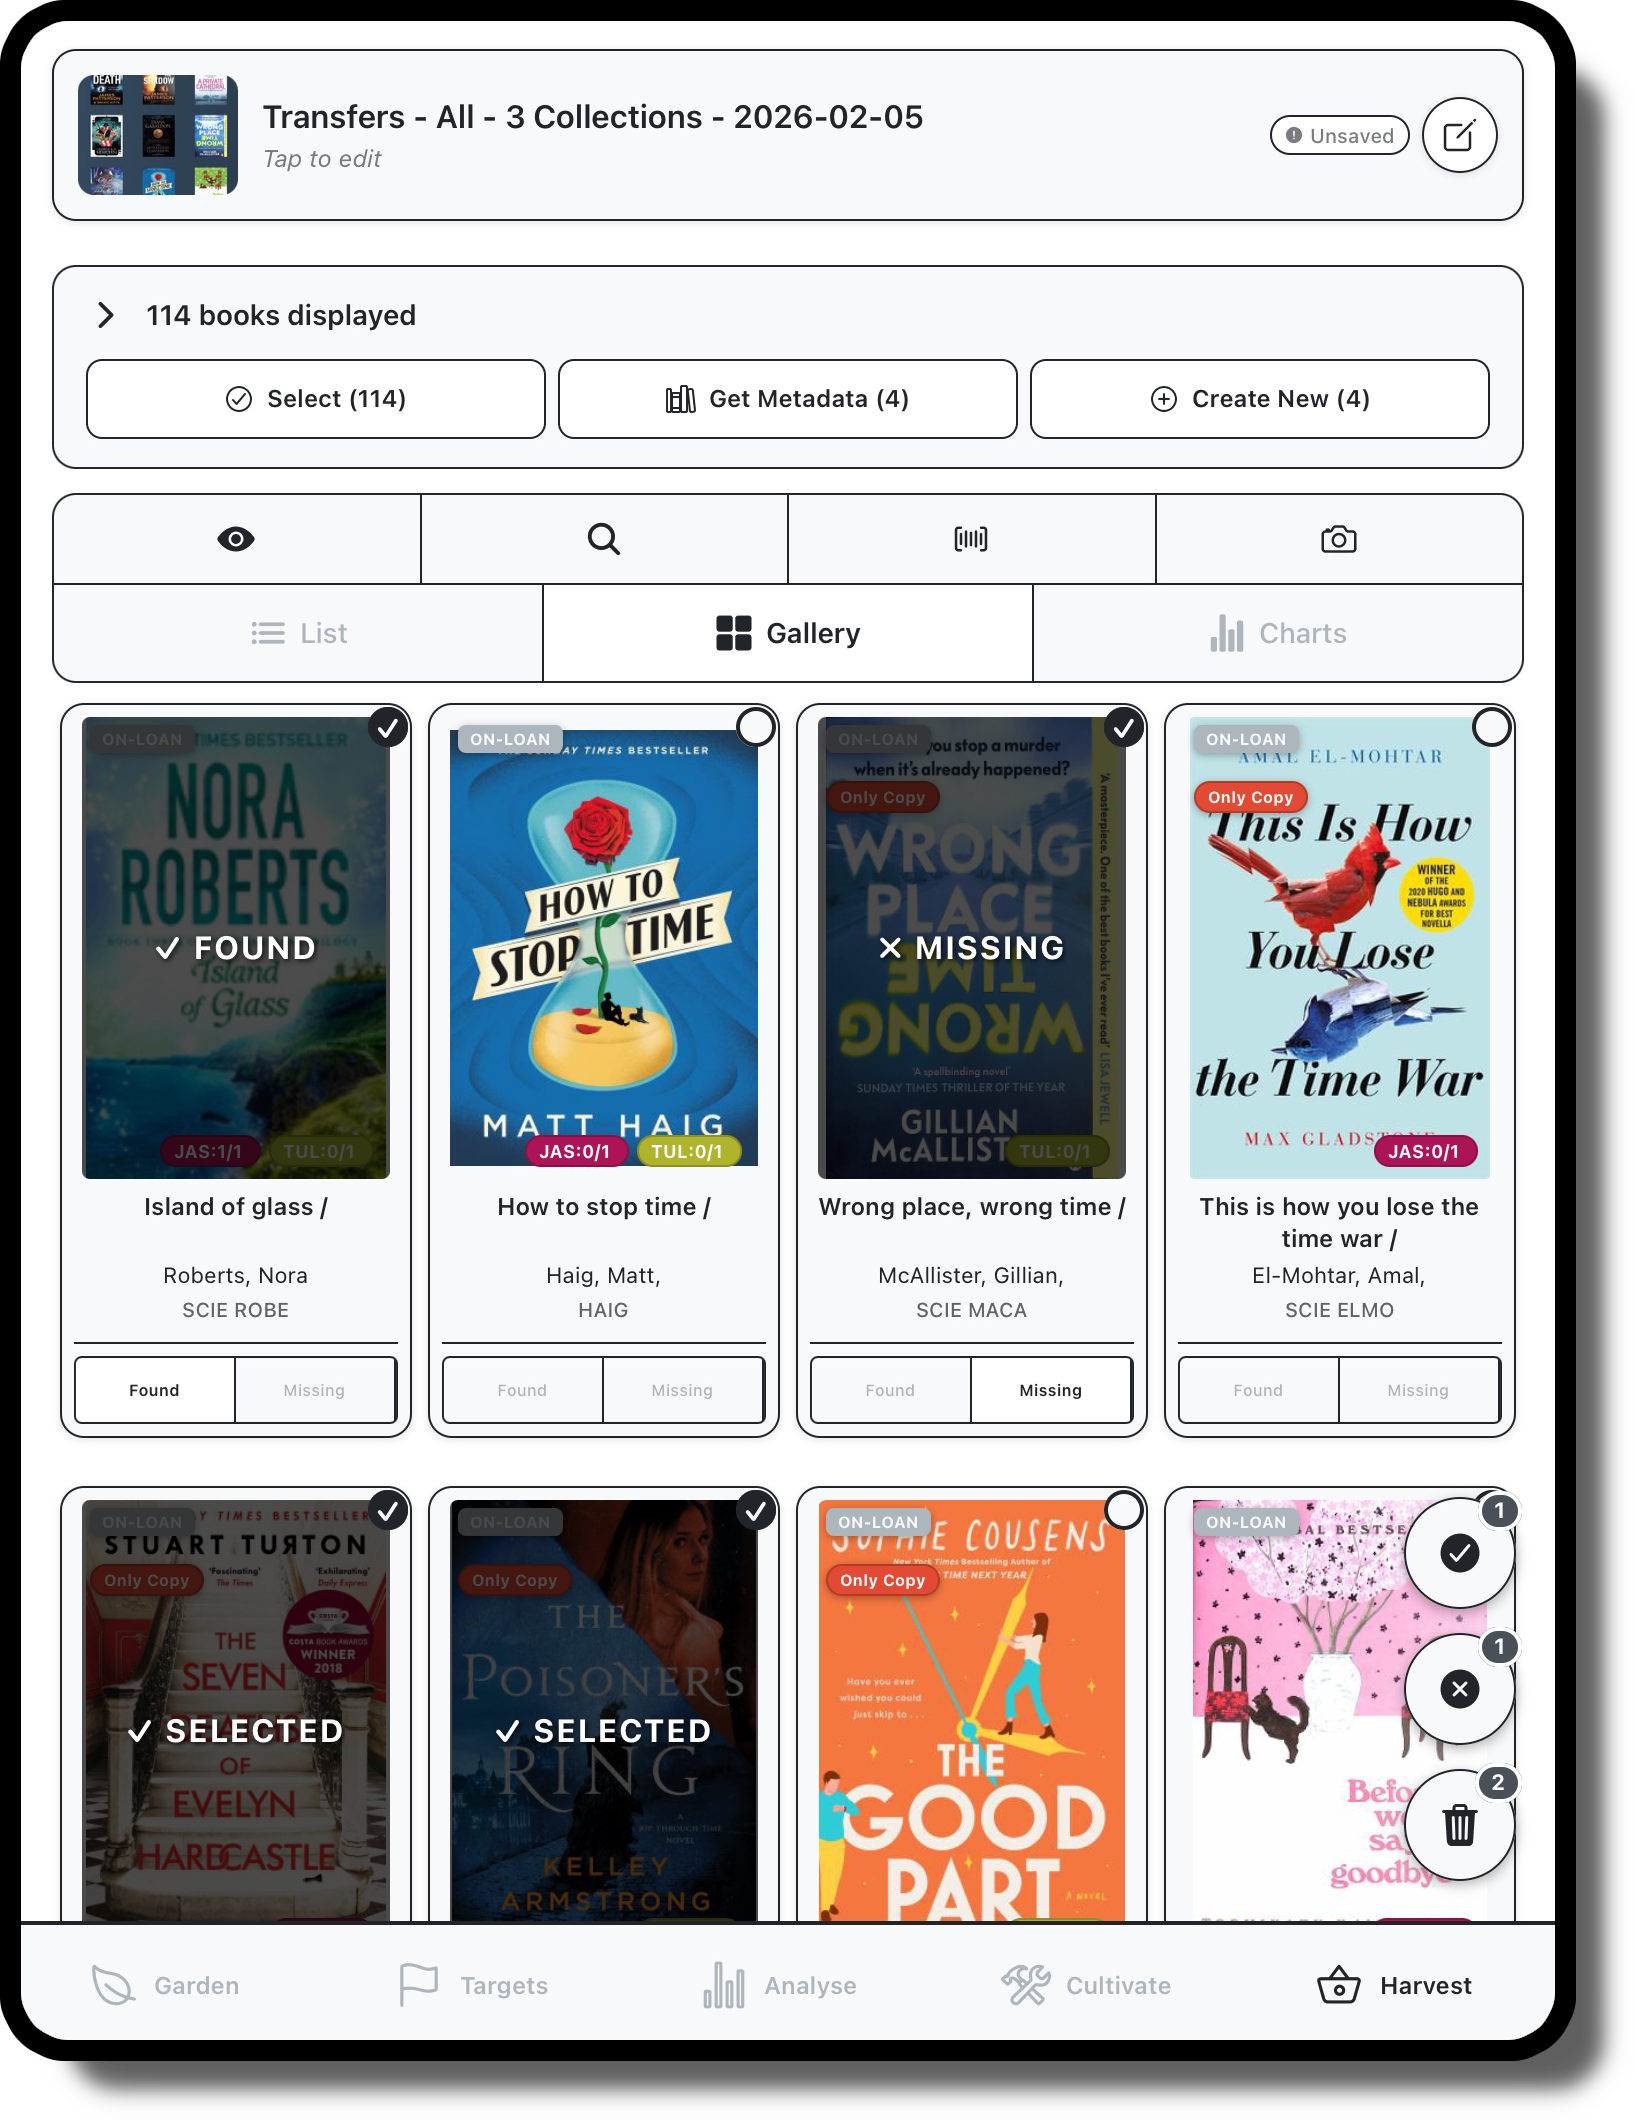
Details
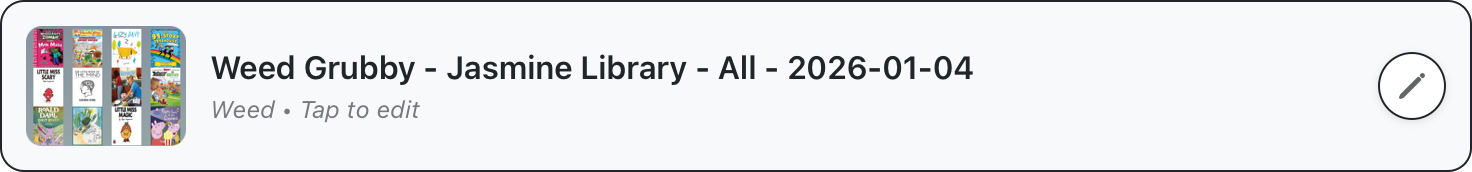
The top panel in this screen displays the crops cover image, name, and type. Tap the pencil icon to edit details of change the crop image.
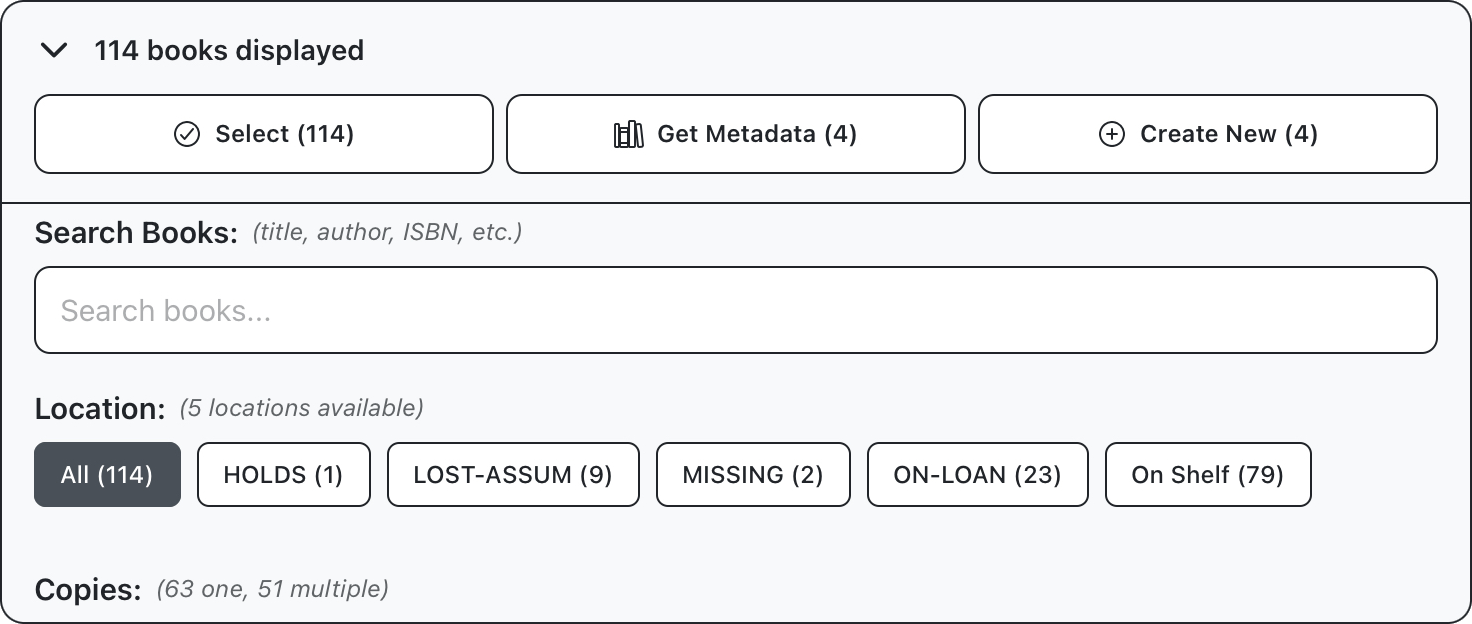
Filter
Use this panel to apply specific actions, like fetching metadata for books, or creating a new crop from selected items. This panel can also be used to run specific searches within the crop, or filter results based on parameters like collection, status, or number of copies.
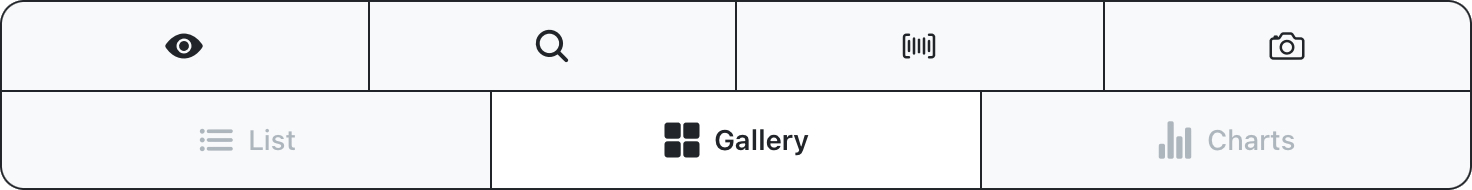
Add Books / Display mode
Use this panel to change the current display mode and show/hide availability badges. There are also controls for adding books to the crop, through scanner, search or manual barcode input.
Display
This panel displays the actual books in your crop and can be used to mark items off or open to see additional detail. There are three display modes available:
List View: Displays a list of items, with badges for status and the number of entries at each library. Use found and missing buttons or tap items to see additional details.
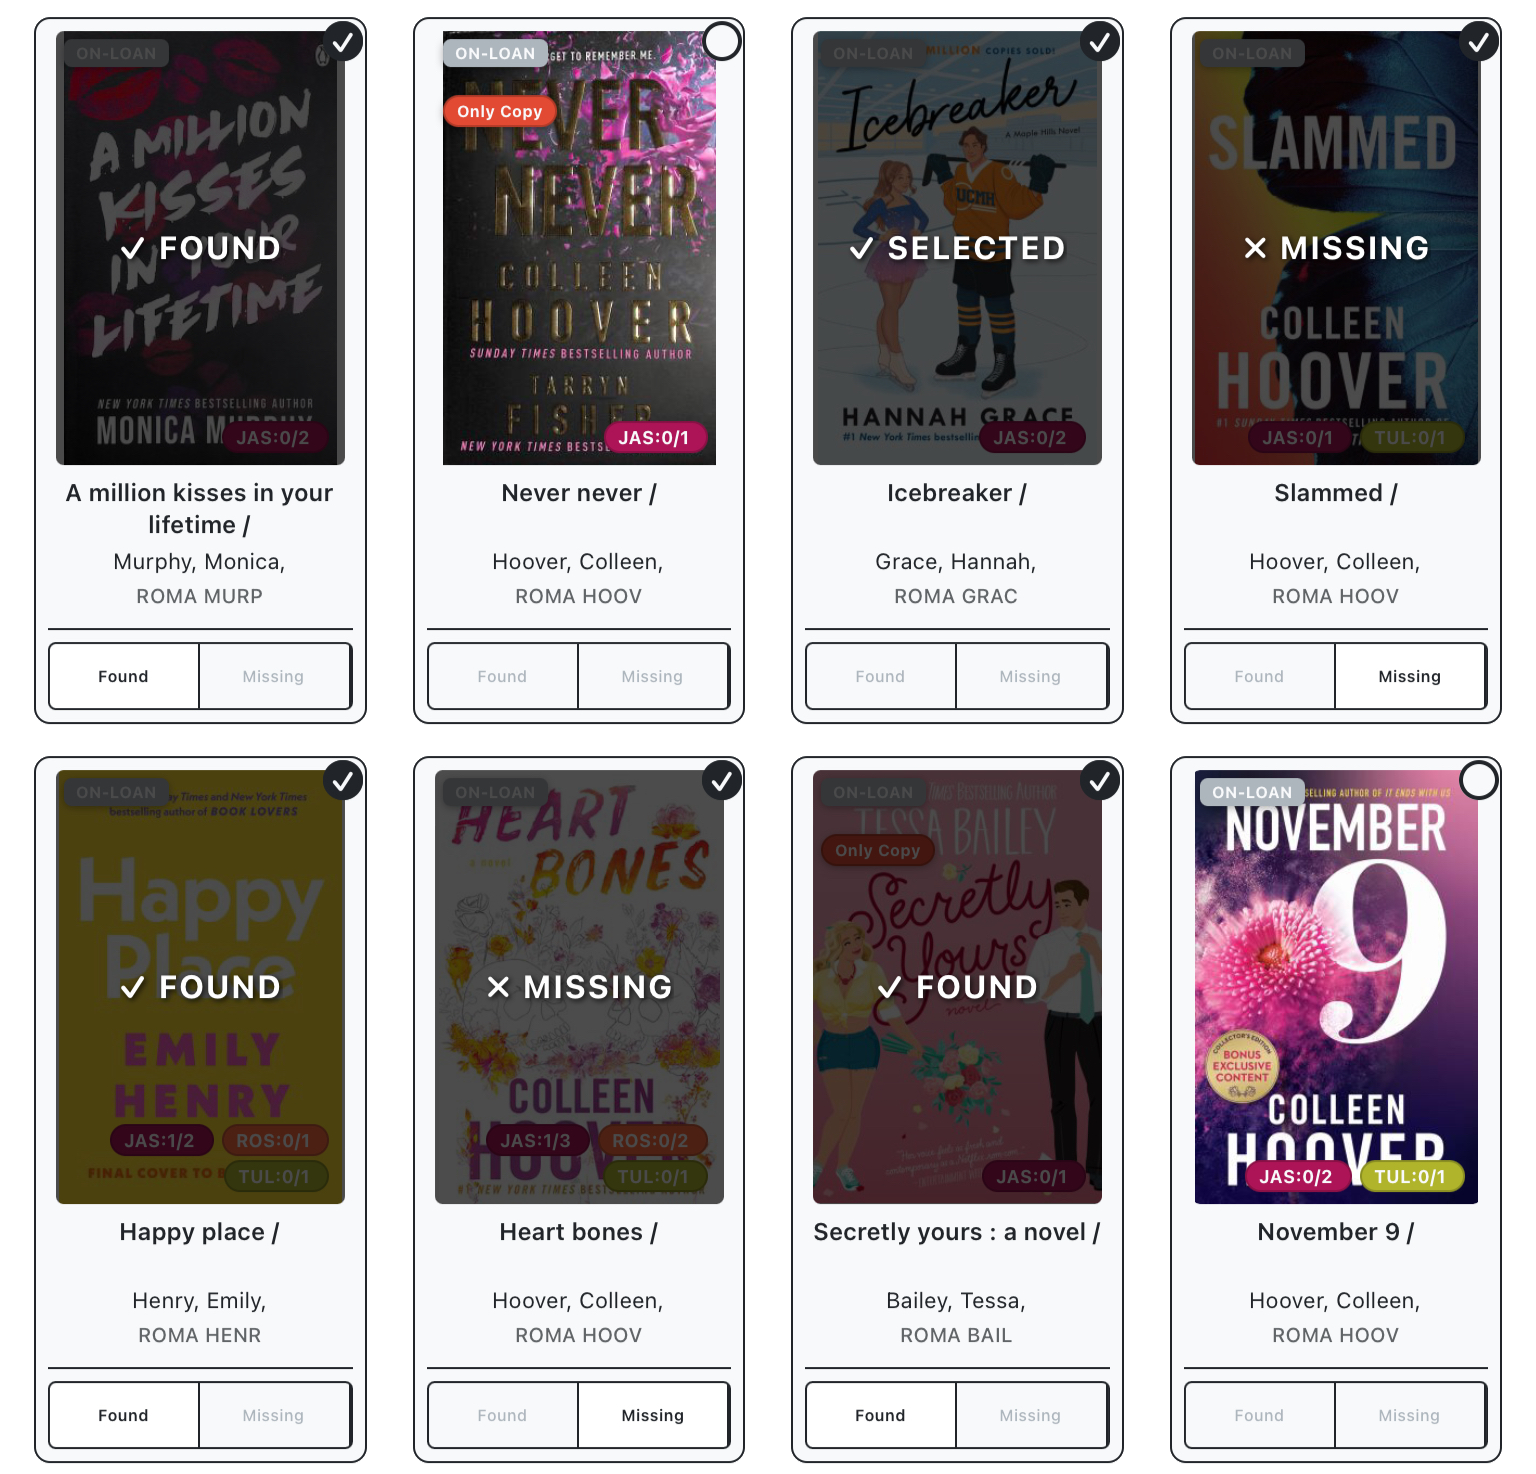
Gallery View: same as list view but displays cover images for each entry. When crops are first created, availability data will be fetched at each library at your branch, and a conditional “only copy” label may be applied.
Chart View: Unlike the previous views, this displays overall statistics rather than data for individual entries. Data can be exported in html and csv format.